Table of Contents Link to heading
- The Kernel’s Role in Process Management
- The /proc Virtual Filesystem
- Process IDs and the Process Hierarchy
- Viewing Processes
- Memory Architecture
- Viewing Memory Usage
- System Log Files
The Kernel’s Role in Process Management Link to heading
The Linux kernel is the intermediary between hardware and software. It accepts commands from shells and applications, manages the processes that carry out those commands, and arbitrates access to hardware resources — memory, disks, network interfaces, and I/O devices.
Every program running on a Linux system is a process — an instance of an executable loaded into memory and assigned resources by the kernel. The kernel is responsible for starting, scheduling, suspending, and terminating processes, and for ensuring that no process can directly interfere with another’s memory space.
The /proc Virtual Filesystem Link to heading
/proc System Files Link to heading
/proc is a pseudo-filesystem — it appears as a directory tree on disk but exists only in RAM. The kernel exposes process information, hardware state, and configuration through /proc as a set of readable (and occasionally writable) files.
Many standard commands you use every day — top, free, mount, lsmod, ps — read their data from /proc. You rarely need to read /proc files directly, but knowing they exist explains why those commands work without requiring privileged disk access.

Key system-level files in /proc:
| File | Contents |
|---|---|
/proc/cmdline |
Kernel boot parameters passed by the bootloader |
/proc/cpuinfo |
CPU model, cores, flags, and architecture details |
/proc/meminfo |
Memory statistics (total, free, cached, swap) — source for free |
/proc/modules |
Currently loaded kernel modules — source for lsmod |
/proc/mounts |
Currently mounted filesystems — source for mount |
/proc/loadavg |
System load averages (1, 5, 15 min) + running/total processes + last PID |
/proc/bus/pci/ |
PCI bus and device information — source for lspci |
/proc/sys/ |
Writable kernel configuration parameters (see below) |
/proc/PID Per-Process Files Link to heading
For each running process, the kernel creates a directory at /proc/PID/ containing files that describe that process:
| File | Contents |
|---|---|
/proc/PID/cmdline |
The command line that launched the process (arguments included) |
/proc/PID/environ |
The process’s environment variables at launch |
/proc/PID/exe |
Symlink to the process’s executable binary |
/proc/PID/fd/ |
One symlink per open file descriptor — useful for recovering deleted files |
/proc/PID/maps |
Memory map: which addresses map to which files or anonymous regions |
/proc/PID/status |
Human-readable process state, memory usage, UID/GID, and more |
/proc/PID/stack |
Current kernel stack — useful when a process is stuck in a system call |
# Inspect a running process (replace PID with actual process ID)
cat /proc/$$/cmdline       # current shell's command line
cat /proc/$$/status        # current shell's status
ls -la /proc/$$/fd/        # open file descriptors
Modifying Kernel Parameters via /proc/sys Link to heading
Files under /proc/sys/ are writable by root and change live kernel behaviour:
# Disable ICMP echo responses (ping) temporarily
echo 1 > /proc/sys/net/ipv4/icmp_echo_ignore_all

# Re-enable ICMP responses
echo 0 > /proc/sys/net/ipv4/icmp_echo_ignore_all

# Enable IP forwarding (required for routing/NAT)
echo 1 > /proc/sys/net/ipv4/ip_forward
Changes via /proc/sys/ are temporary — they revert at reboot. For permanent changes, use sysctl:
# Apply immediately and persistently
sysctl -w net.ipv4.ip_forward=1
echo "net.ipv4.ip_forward=1" >> /etc/sysctl.conf    # persist across reboots
sysctl -p                                              # reload from /etc/sysctl.conf
Process IDs and the Process Hierarchy Link to heading
Every running process is assigned a unique Process ID (PID). PIDs are assigned sequentially as processes are created.
PID 1 is the init process — the first user-space process started by the kernel after boot. On modern systemd-based systems, PID 1 is systemd; on older System V-based systems, it is /sbin/init. All other processes on the system are descendants of PID 1.
The process relationship model:
- A parent process spawns one or more child processes
- The child inherits the parent’s environment and open file descriptors
- When a child process exits, it becomes a zombie until the parent reads its exit status
- If a parent exits before its children, the children are reparented to PID 1 (systemd), which reaps them
The maximum PID value is configurable via /proc/sys/kernel/pid_max (default 32768 on 32-bit, 4194304 on 64-bit). When the maximum is reached, the kernel wraps around and reuses available lower PIDs.
Viewing Processes Link to heading
pstree: Process Hierarchy as a Tree Link to heading
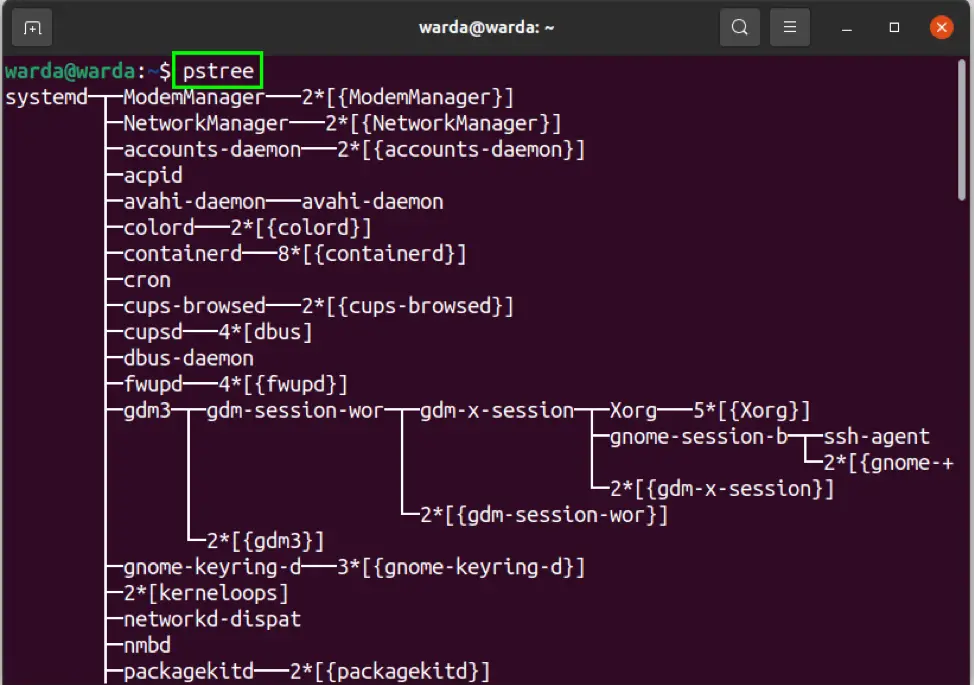
pstree shows the parent-child relationships between all running processes:
pstree                  # tree rooted at PID 1
pstree -p               # include PIDs
pstree -u               # show owning user
pstree username         # tree for a specific user's processes
ps: Point-in-Time Process Snapshot Link to heading
ps captures a snapshot of running processes at the moment of execution.
ps                      # processes in current shell only
ps aux                  # all processes, all users (BSD syntax)
ps -ef                  # all processes, full format (POSIX syntax)
ps -ef | head           # first 10 lines
ps -e | grep nginx      # filter for a specific process
ps aux | sort -k3 -rn | head    # top CPU-consuming processes
ps aux --sort=-%mem | head      # top memory-consuming processes
ps --forest             # show parent-child hierarchy (similar to pstree)
Key columns in ps aux output:
| Column | Meaning |
|---|---|
| USER | Owner of the process |
| PID | Process ID |
| %CPU | CPU usage percentage |
| %MEM | Physical memory percentage |
| VSZ | Virtual memory size (KB) |
| RSS | Resident Set Size — actual physical RAM used (KB) |
| STAT | Process state (R=running, S=sleeping, Z=zombie, D=uninterruptible sleep) |
| START | When the process started |
| TIME | Accumulated CPU time |
| COMMAND | Command name and arguments |
top: Real-Time Process Monitor Link to heading
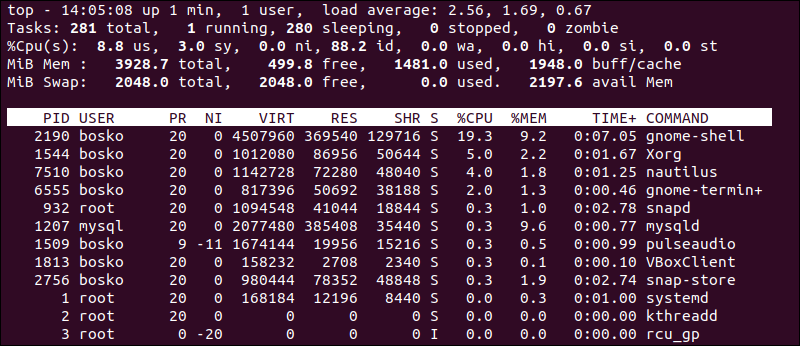
top provides a continuously updated view of the most CPU-intensive processes:
top                     # default view
top -u username         # filter to a specific user
top -p PID1,PID2        # monitor specific PIDs only
top -bn1                # one-time batch output (useful for scripting)
Interactive keys in top:
| Key | Action |
|---|---|
k |
Kill a process (prompts for PID and signal) |
r |
Renice a process (adjust priority) |
M |
Sort by memory usage |
P |
Sort by CPU usage (default) |
T |
Sort by cumulative time |
u |
Filter by username |
1 |
Toggle per-CPU display |
q |
Quit |
Load averages (shown in the top line) represent the average number of runnable processes over the last 1, 5, and 15 minutes. A load average at or below the number of CPU cores indicates a healthy system; sustained values above the core count indicate CPU saturation.
uptime                  # show load averages and system uptime
cat /proc/loadavg       # raw load average data
htop is a more feature-rich alternative to top — colour-coded output, mouse support, scrollable process list, and easier process management. It is not installed by default on most distributions but is available in all major package repositories: apt install htop or dnf install htop.Memory Architecture Link to heading
Physical RAM and Virtual Addressing Link to heading
The Linux kernel uses virtual addressing to present each process with its own view of memory — a contiguous address space that may be larger than physical RAM. The kernel’s Memory Management Unit (MMU) translates virtual addresses to physical RAM locations.
This design provides three critical properties:
- Isolation: One process cannot read or write another process’s memory
- Overcommitment: Processes can allocate more virtual memory than physical RAM exists, relying on the kernel to provide physical pages on demand
- Consistency: Processes see a uniform address layout regardless of physical RAM fragmentation
Memory is managed in fixed-size pages (typically 4 KB). When a process accesses a virtual address that maps to a physical page, the hardware handles the translation transparently. When the address maps to a page that has been swapped to disk, the kernel loads the page from disk before execution continues.
Kernel Space and User Space Link to heading
Memory is divided into two fundamental regions:
Kernel space: The memory range where kernel code and data structures reside. Processes in user space cannot directly access kernel space — doing so triggers a hardware protection fault. Processes interact with the kernel via system calls — well-defined API entry points that transfer control to the kernel for specific operations (opening files, allocating memory, sending network packets).
User space: Where application processes run. Each process has its own isolated user-space virtual address range. The separation ensures that a buggy or malicious application cannot corrupt the kernel or other processes.
Swap Space Link to heading
When physical RAM is exhausted, the kernel moves least-recently-used pages from RAM to a designated area on disk — the swap partition or swapfile. This extends the effective memory available to running processes at the cost of performance: disk I/O is orders of magnitude slower than RAM access.
swapon --show           # show configured swap devices and usage
cat /proc/swaps         # swap status from /proc
Sustained swap activity (visible as non-zero si/so columns in vmstat) indicates the system is memory-constrained. The correct response is to add RAM, reduce per-process memory consumption, or migrate workloads to systems with more memory — not to increase swap size, which only delays the symptoms.
Viewing Memory Usage Link to heading
free -h                 # human-readable snapshot
free -h -s 5            # refresh every 5 seconds
vmstat 1 10             # virtual memory statistics (10 samples, 1-second interval)
cat /proc/meminfo       # raw kernel memory breakdown
Key free output fields:
| Field | Meaning |
|---|---|
| total | Total installed RAM |
| used | RAM in use by processes |
| free | RAM completely unused |
| shared | RAM used for shared memory and tmpfs |
| buff/cache | RAM used for disk buffers and filesystem cache (reclaimable) |
| available | Estimate of RAM available without swapping — the operationally relevant number |
free but significant buff/cache is not “running out of memory” — Linux deliberately uses spare RAM for caching to improve I/O performance. The available column is the metric to monitor. When available approaches zero and swap usage starts climbing, the system is genuinely memory-constrained.System Log Files Link to heading
Logging Daemons: syslog, rsyslog, and journald Link to heading
Linux logging has evolved through several generations:
syslogd + klogd (legacy): Two separate daemons — one for system messages, one for kernel messages. Found only on very old distributions.
rsyslogd: Replaced the legacy pair on most distributions. Supports structured logging, multiple output destinations (files, network, databases), and filtering rules. Configuration in /etc/rsyslog.conf and /etc/rsyslog.d/.
journald (systemd systems): The logging component of systemd. Captures all service output, kernel messages, and system events in a structured binary journal. Messages are queryable with rich filters; the binary format enables indexing and fast search. Configuration in /etc/systemd/journald.conf.
# journald — primary tool on systemd systems
journalctl                          # all journal entries
journalctl -f                       # follow (like tail -f)
journalctl -n 50                    # last 50 lines
journalctl -u nginx                 # entries for a specific unit
journalctl --since "2024-01-01" --until "2024-01-02"
journalctl -p err                   # errors and above only
journalctl -k                       # kernel messages only
journalctl --disk-usage             # journal size on disk
Key Files in /var/log Link to heading
| File | Contents |
|---|---|
/var/log/syslog |
General system messages (Debian/Ubuntu) |
/var/log/messages |
General system messages (RHEL/CentOS) |
/var/log/auth.log |
Authentication events, sudo, SSH (Debian/Ubuntu) |
/var/log/secure |
Authentication events (RHEL/CentOS) |
/var/log/kern.log |
Kernel messages |
/var/log/dmesg |
Kernel messages captured at boot |
/var/log/boot.log |
Service start/stop messages during boot |
/var/log/cron |
Cron job execution records |
/var/log/maillog |
Mail server messages |
/var/log/journal/ |
systemd journal (binary — use journalctl) |
/var/log/wtmp |
Login/logout history (binary — use last) |
/var/log/btmp |
Failed login attempts (binary — use lastb) |
Viewing Log Files Link to heading
# Text log files
tail -f /var/log/auth.log           # follow live
grep "Failed password" /var/log/auth.log | tail -20
grep "sshd" /var/log/auth.log | grep "$(date +%b\ %d)" | wc -l   # today's SSH events

# Determine file type before viewing
file /var/log/wtmp          # "data" = binary
file /var/log/syslog        # "ASCII text" = safe to cat/grep

# Binary log files require specific commands
last                        # reads /var/log/wtmp — login history
lastb                       # reads /var/log/btmp — failed logins (requires root)

# Compressed rotated logs
zcat /var/log/syslog.1.gz | grep "error"
zgrep "ERROR" /var/log/nginx/error.log.*.gz
Log Rotation Link to heading
logrotate is the standard tool for managing log file growth. It runs via cron (typically daily) and:
- Renames the current log file with a date or numeric suffix (e.g.,
syslog.1orsyslog-20240101) - Creates a new empty log file with the original name
- Signals the logging daemon to switch to the new file
- Compresses old log files (typically after one rotation cycle)
- Deletes log files older than the configured retention period
Configuration is in /etc/logrotate.conf and per-application files in /etc/logrotate.d/. Compressed rotated files end in .gz and require zcat/zless/zgrep to read.
Kernel Ring Buffer: dmesg Link to heading
The kernel maintains a circular ring buffer of messages generated during boot and runtime. dmesg reads and displays this buffer:
dmesg                           # all kernel messages
dmesg | tail -20                # most recent kernel messages
dmesg | grep -i usb             # filter for USB-related messages
dmesg | grep -i error           # filter for errors
dmesg -T                        # human-readable timestamps (Linux 3.5+)
dmesg -w                        # follow new messages (like tail -f)
dmesg --level err,crit,alert    # only high-severity messages
dmesg is the primary tool for diagnosing hardware problems (failed device detection, driver errors), boot issues, and kernel panics. The ring buffer has a fixed size — on busy systems, old messages are overwritten. The /var/log/dmesg file captures the kernel messages from the last boot before they can be overwritten.
# On systemd systems, kernel messages are also in the journal
journalctl -k                   # equivalent to dmesg, but persistent across reboots
journalctl -k --boot=-1         # kernel messages from the previous boot